
Track analysis with Heatline
Read elevation, gradient and speed along a route or track, compare colour scales, inspect individual points and export the analysis.
The screenshots show the English app interface with synthetic example data. The example is not a suggested walking route or a terrain survey. Tap an image to enlarge it.
1. Open a route or track
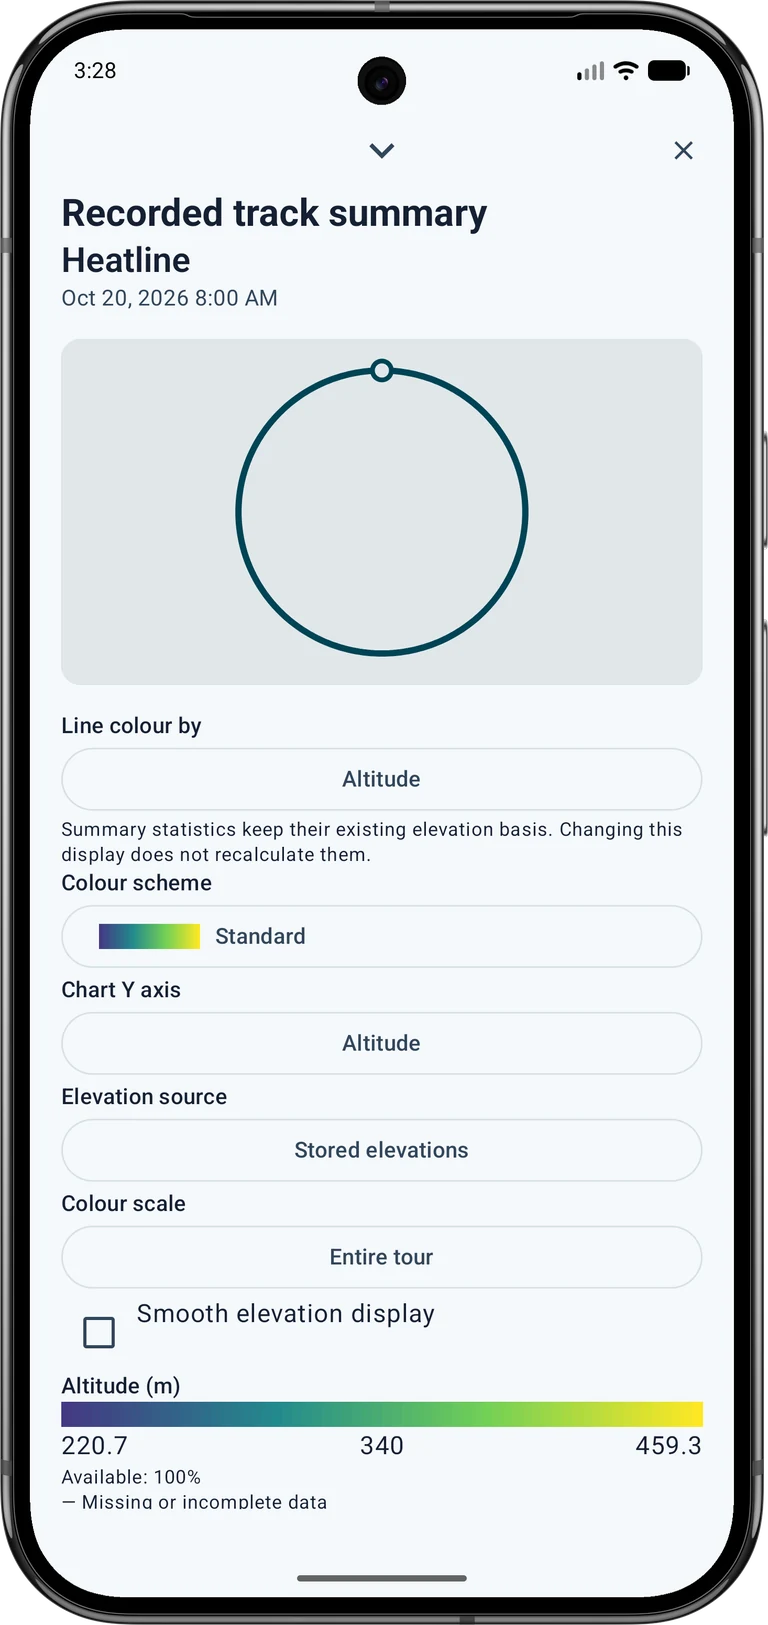
Open the object list and press and hold a saved route or track. Expand its details and open the summary. For a recorded track, the summary contains the analysis controls; other line objects offer Line analysis. Scroll down if the controls are below the preview.
Start with a recording or import that contains the measurements you want to inspect. Elevation needs height values; speed and elapsed time need suitable time or speed data. A planned line without timestamps cannot describe your actual walking speed.
2. Choose what the colours mean
Under Line colour by, choose elevation, gradient, speed, horizontal uncertainty or vertical uncertainty. The availability percentage shows how much of the line has usable values. Grey sections mean missing or incomplete data.
Set Chart Y axis separately. For example, keep elevation on the chart while colouring the line by speed. The reported uncertainty is a receiver estimate, not the measured distance from your true position. Horizontal and vertical uncertainty are different quantities.
3. Read and compare the scale
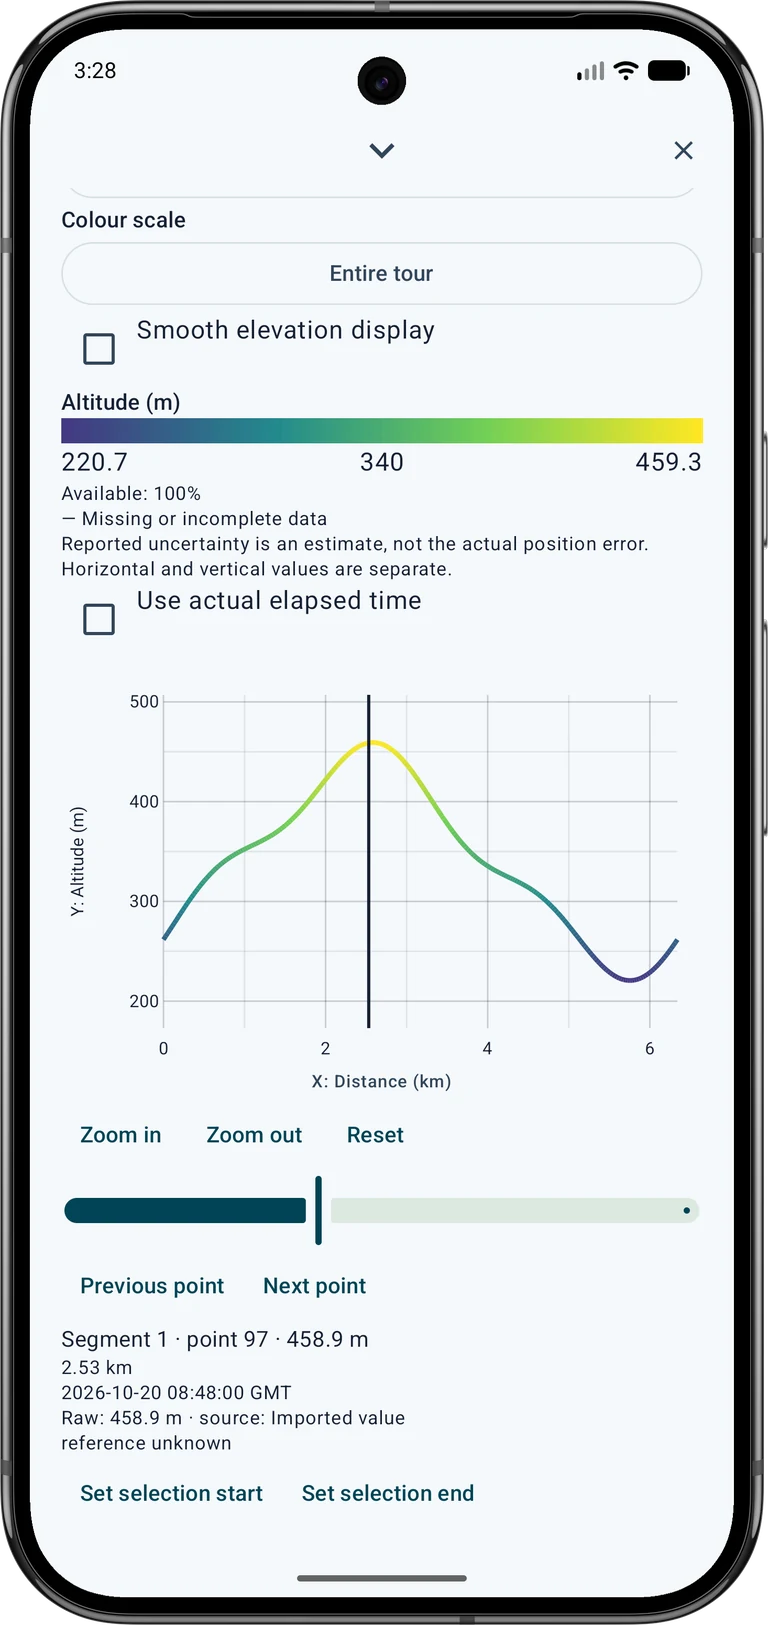
For Colour scale, use Fixed to compare tours with the same limits. Entire tour adapts the limits to the complete object. Custom range lets you enter your own lower and upper limits. Always read the unit and numbers in the legend before comparing colours.
Zooming does not rescale the colours to the visible section. Values outside your chosen range use the end colour; their original numbers remain in the point details. A bright colour alone is not a warning or a statement about route safety.
4. Inspect points and select a section
Tap the chart to select an original point. Read its value, distance, timestamp and source below the chart. Use the previous and next point controls for precise selection, and zoom or pan to inspect a shorter section.
Choose Set selection start at the first point, then select the last point and choose Set selection end. Clear section selection restores the full range. Use View on map to locate the selection. The time axis is useful only when valid timestamps are available.
5. Check the elevation source
Under Elevation source, choose Stored elevations or deliberately select Local terrain data. Local terrain files must cover the route. Their resolution, height reference and whether they describe the ground or the surface affect the interpretation; coarse data may not support a useful gradient.
Slope is calculated over a spatial window, rather than from every tiny height jump. Smoothing changes the display; original measurements remain intact. Changing this display does not recalculate the existing summary statistics.
6. Save or share the result
Use Save analysis CSV for a numerical analysis export. A native MapTools project preserves its supported analysis settings; GPX is an exchange format and does not preserve the Heatline style. Save a project copy as well when you want to continue the same analysis later.
PNG export can show the map, chart or both, including the selected section, colours and legend. Review the preview, background, crop, rotation and source credits before saving or sharing. Google map backgrounds are excluded from this export. External maps and terrain may require a licence, registration or payment; permission to view them does not automatically allow redistribution. See Free / Pro for feature availability.